Low Serum Level of High-density Lipoprotein Cholesterol Is Associated with Gastric Cancer Regardless of Sex and Tumor Stage
Article information

Abstract
Background/Aims
HDL cholesterol (HDL-C) may have anti-tumor effects; however, the effects remain unclear. Thus, this study aimed to investigate sex- and tumor stage-specific association of hyperglycemia and HDL-C with gastric cancer.
Materials and Methods
We used the National Health Insurance Service data. All participants underwent gastric cancer screening between January and December 2011. Hyperglycemia and HDL-C levels were categorized according to the World Health Organization guideline and Adult Treatment Panel III. Adjusted regression analysis was performed using ORs and 95% CIs.
Results
Gastric cancer was detected in 10,417 of 5.49 million individuals (2.43 million men). Hyperglycemia (OR, 1.28; 95% CI, 1.20~1.36) and low HDL-C levels (OR, 1.41; 95% CI, 1.35~1.48) were associated with gastric cancer. In the sub-analysis by sex, hyperglycemia (≥126 mg/dL) was associated with gastric cancer in both men (OR, 1.26; 95% CI, 1.18~1.36) and women (OR, 1.32; 95% CI, 1.17~1.49). Low HDL-C levels were associated with gastric cancer in both men (OR, 1.49; 95% CI, 1.40~1.58) and women (OR, 1.32; 95% CI, 1.27~1.42). In the sub-analysis by tumor stage, hyperglycemia was associated with both early (OR, 1.14; 95% CI, 1.08~1.20) and advanced gastric cancer (OR, 1.39; 95% CI, 1.26~1.55). Low HDL-C levels were also associated with early (OR, 1.34; 95% CI, 1.27~1.41) and advanced gastric cancer (OR, 1.92; 95% CI, 1.74~2.13).
Conclusions
Hyperglycemia and low HDL-C levels are consistently associated with gastric cancer regardless of sex or tumor stage.
INTRODUCTION
Gastric cancer was reported as the fourth leading cause of cancer death in global cancer statistics 2020 [1]. Although a meta-analysis suggests a positive association between serum glucose levels and the risk of hormonally driven cancer [2], associations between metabolic factors and gastric cancer have rarely been identified. A small Korean nested case-control study showed no association between serum glucose levels and gastric cancer [3]. However, Japanese cohort studies suggested that high fasting glucose and hemoglobin A1c increased the risk of gastric cancer [4,5]. HDL-cholesterol (HDL-C) is well known to be a good cholesterol, protecting cardiovascular disease. Furthermore, protective role of HDL-C in some cancers was recently suggested. The effect of serum HDL-C on gastric cancer has been rarely reported. Obesity is strongly associated with many cancers [6], but the relationship between obesity and gastric cancer is controversial. In a meta-analysis, high BMI increases the risk of cardiac gastric cancer but not non-cardiac gastric cancer (NCGC) [7]. Several studies suggest that high BMI reduces the risk of NCGC [8,9], whereas other studies show no association [10,11]. These different results may be due to different composition of study population such as sex, age, cancer site and stage. Actually, patients with early gastric cancer (EGC) rarely experience weight loss, whereas advanced gastric cancer (AGC) patients frequently experience weight loss.
We investigated the effect of metabolic factors on gastric cancer using a large data from the National Health Insurance Service System (NHISS). Recently, many studies suggested that sex difference in hormonal and social factors produce sex discrepancy in the risk of many diseases. Therefore, we investigated the sex- and stage-specific effect of HDL-C and hyperglycemia on gastric cancer.
MATERIALS AND METHODS
1. Data extraction and contents of data
This study used data from National Health Insurance System-National Sample Cohort (NHIS-NSC) data (REQ 0000006487) collected by the NHISS. The NHIS-NSC data included data from both the NHIS and National Cancer Screening Program (NCSP). The NHIS database included sex, insurance, T40 disease code data, and National General Health Examination (NGHE) data (Supplementary Table 1). T40 includes all disease codes claimed by medical clinic whenever patients visit to any type of medical clinic. Economic status was measured using annual national health insurance paid by individuals categorized from 1 to 20. One is the lowest level and 20 is highest level. The NGHE data included chronic disease (hypertension, heart disease, diabetes mellitus, and cerebrovascular disease), medication, habits, family history, obesity indices, and blood chemistry. Heart disease means myocardial infarction or angina pectoris. Cerebrovascular disease means cerebral ischemia or hemorrhage. Blood levels of lipid and glucose were measured after 12 hours of fasting. BMI was calculated as weight/height2 (kg/m2).
The Korean NCSP provides gastric cancer screening using endoscopy or gastrography for persons aged 40 years or over every other year [12]. If any positive finding in gastrography was observed, endoscopy was additionally performed. Endoscopic screening reports included endoscopic findings, site of lesion, pathologic results, final diagnosis, and previously diagnosed gastric cancer, and family history of gastric cancer (Supplementary Table 2). The final diagnosis was reported as normal, benign disease, suspected gastric cancer, gastric cancer, and others. If gastric neoplasm was suspected on screening endoscopy but pathologically indefinite, repeated endoscopy were performed. Gastric cancers detected in additional or repeated endoscopy were also sensed in T40 (C16).
2. Study population
Subjects who underwent both national gastric cancer screening and NGHE from January 2011 to December 2011 were included. We excluded subjects who had been diagnosed with gastric cancer before 2011 and subjects with pre-existing gastric cancer based on NCSP questionnaires (Fig. 1). In this study, the presence of gastric cancer was defined as (1) gastric cancer in the NCSP final diagnosis or (2) suspected gastric cancer in the NCSP final diagnosis and sensing gastric cancer (C16) in T40 disease code. To define the absence of gastric cancer or adenoma, we included a normal, benign lesion or others in the NCSP final diagnosis. And then, we excluded patients with gastric cancer (C16) and gastric adenoma (D131) sensing in T40 disease code (Fig. 1). This study was approved by the Institutional Review Board of the Kyungpook National University Hospital Chilgok (KNUHC 2016-08-024).
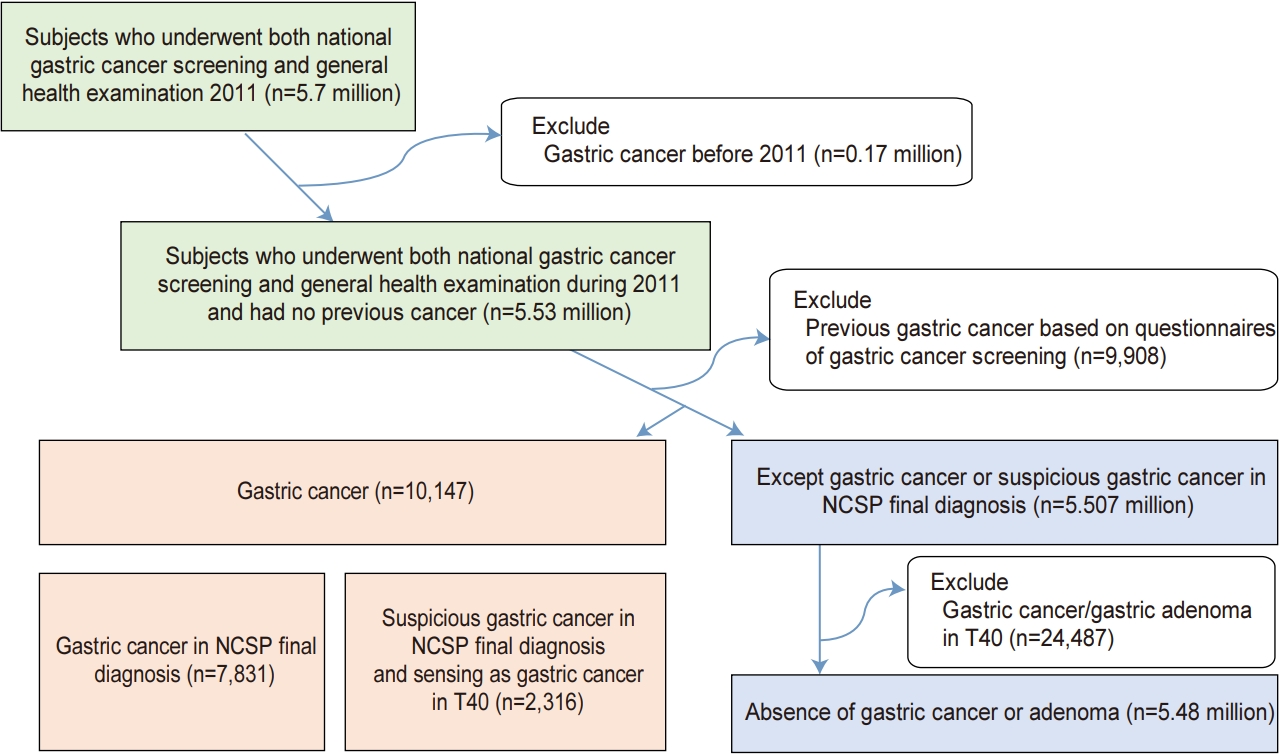
Study flow. National Health Insurance Service System. Eligible participants underwent gastric cancer screening and general health examination. NCSP, National Cancer Screening Program.
3. Study outcome
We investigated the sex- and stage-specific association of HDL-C, hyperglycemia, and BMI with gastric cancer.
4. Statistical analysis
Pearson chi-square or independent t-tests were used to assess the differences between groups with and without gastric cancer with regard to demographic characteristics, BMI, and serum level of lipids and glucose. Continuous variables were classified into categorical variables. BMI was classified as low (<18.5 kg/m2), normal (18.5~22.9 kg/m2), and overweight (23~24.9 kg/m2), obesity I (25~29.9 kg/m2), and obesity II (≥30 kg/m2) according to Asian-Pacific guidelines [13]. We set normal BMI as reference. HDL-C was classified as low (<40 mg/dL in men and <50 mg/dL in women) and normal (≥40 mg/dL in men and ≥50 mg/dL in women) by Clinical Identification of the Metabolic Syndrome of National Cholesterol Education Program and Adult Treatment Panel. Serum fasting glucose was categorized into normal (<110 mg/dL), intermediate (110~125), and high (≥126 mg/dL or previous diagnosis of diabetes) by World Health Organization criteria [14]. Age was categorized by 10-year intervals (40~49, 50~59, 60~69, and ≥70 years). Stage was classified as EGC and AGC.
Contributing factors to gastric cancer were estimated by logistic regression using OR and 95% CI. We performed a sub-analysis by sex and stage of gastric cancer. All analyses were conducted using SAS software (version 9; SAS Institute, Cary, NC, USA). All statistical tests were two-sided, and values of P<0.05 were considered statistically significant.
RESULTS
1. Demographic and laboratory findings
A total of 5.492 million subjects with 2.427 million men (44.2%) and a mean age of 55.7 years were finally eligible and 10,147 gastric cancers were detected (Fig. 1). Most cancers were located in antrum (43.6%) and body (48.7%), whereas cancers were rarely located in cardia (2.2%) and fundus (5.6%). Because gastric cancer was detected during routine gastric cancer screening, most are EGC (n=7,875; 77.6%), AGC was 17.8% (n=1,808), and remains are unknown stage (n=464; 4.6%). Gastric cancer had an association with many epidemiologic and laboratory factors (Table 1).
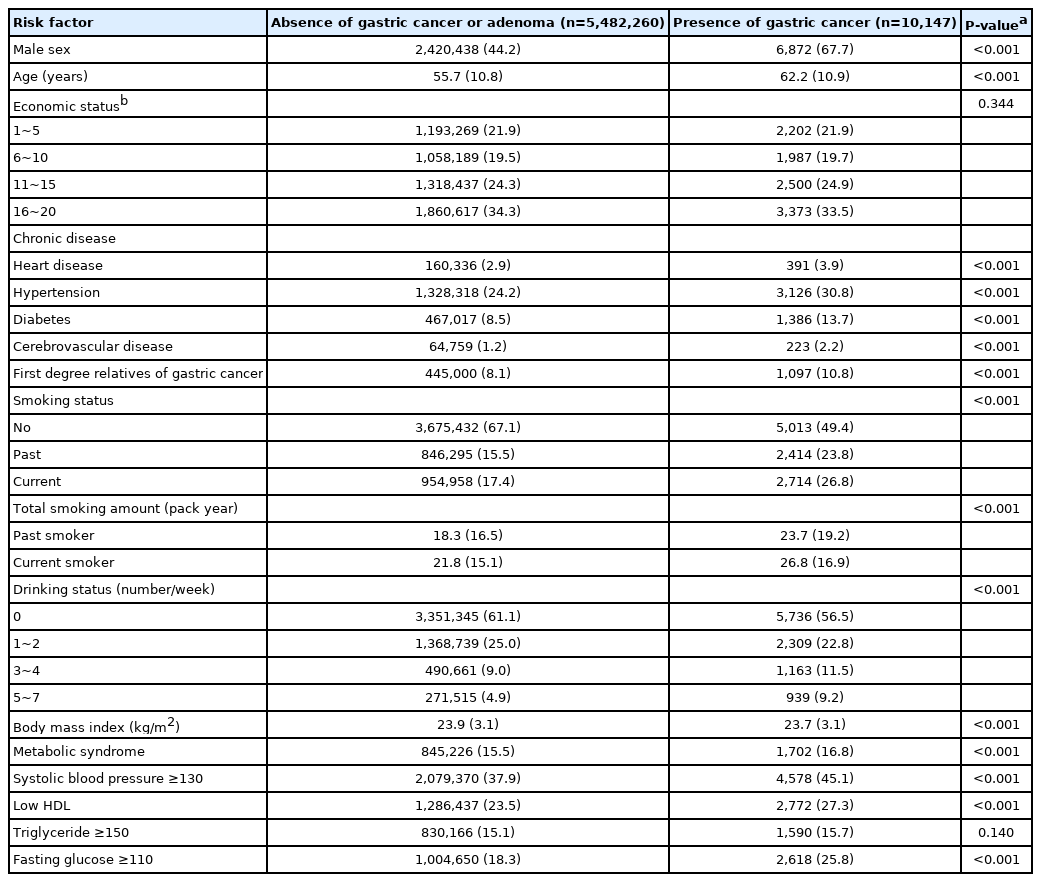
Demographic and Laboratory Findings
2. Contributing factors of gastric cancer
In unadjusted analyses, low HDL-C, hyperglycemia, and many demographic factors were associated with gastric cancer (Supplementary Table 3). In adjusted analyses, low HDL-C (OR, 1.41; 95% CI, 1.35~1.48), high fasting glucose (OR, 1.28; 95% CI, 1.20~1.36), and underweight (OR, 1.37; 95% CI, 1.29~1.52) was associated with gastric cancer (Table 2). Higher BMI associated with decreased gastric cancer comparing to normal BMI. Male sex, increasing age, first-degree relatives with gastric cancer, ex-smoker, current smoker, and frequent alcohol drinking was positively associated with gastric cancer.
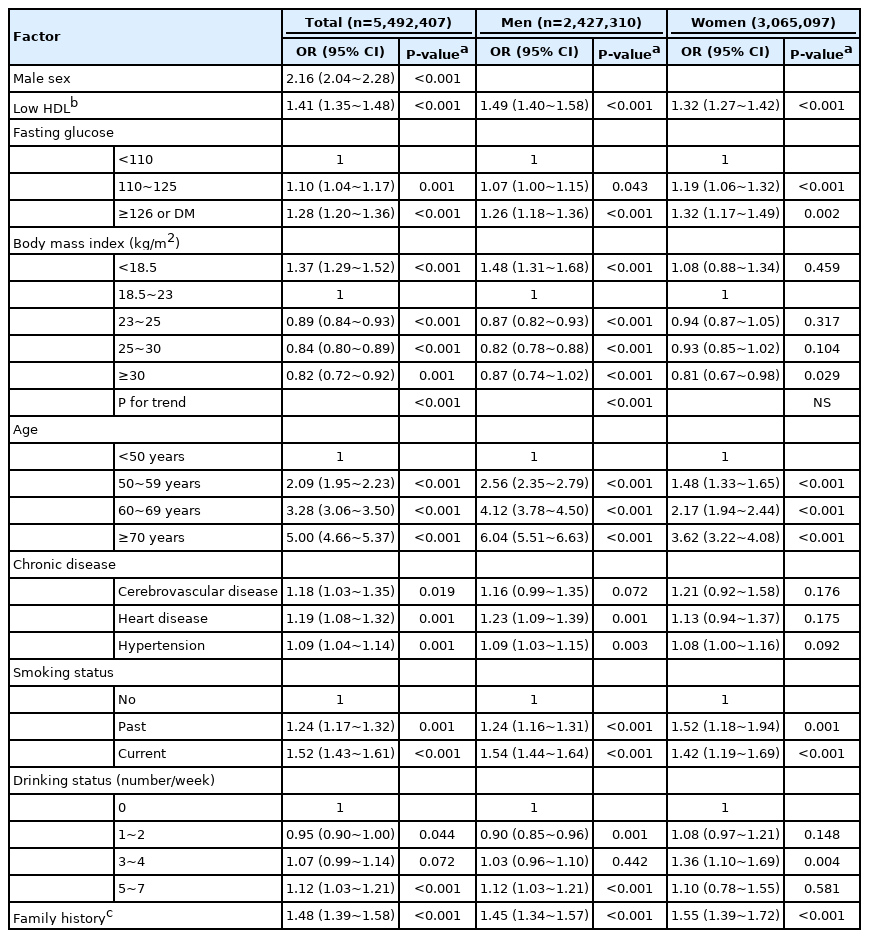
Contributing Factors to Gastric Cancer According to Sex (Multivariate Analysis)
3. Sub-analysis by sex
In univariate analysis, low BMI was associated with gastric cancer in men but not in women, whereas low HDL-C and high glucose was associated with gastric cancer in both men and women (Supplementary Table 3). In adjusted analysis, most factors commonly contributed to gastric cancer regardless of sex except BMI (Table 2). Low BMI was associated with gastric cancer in men (OR, 1.48; 95% CI, 1.31~1.68) but not in women. Overweight and obesity was associated with a low risk of gastric cancer in men (OR, 0.82~0.87) and only the highest BMI group was associated with a low risk of gastric cancer in women (OR, 0.81; 95% CI, 0.67~0.98) (Fig. 2A). The positive relationship between gastric cancer and aging was more prominent in men than women. High fasting glucose and low HDL-C were consistently associated with gastric cancer in both sexes (Table 2, Fig. 2B).
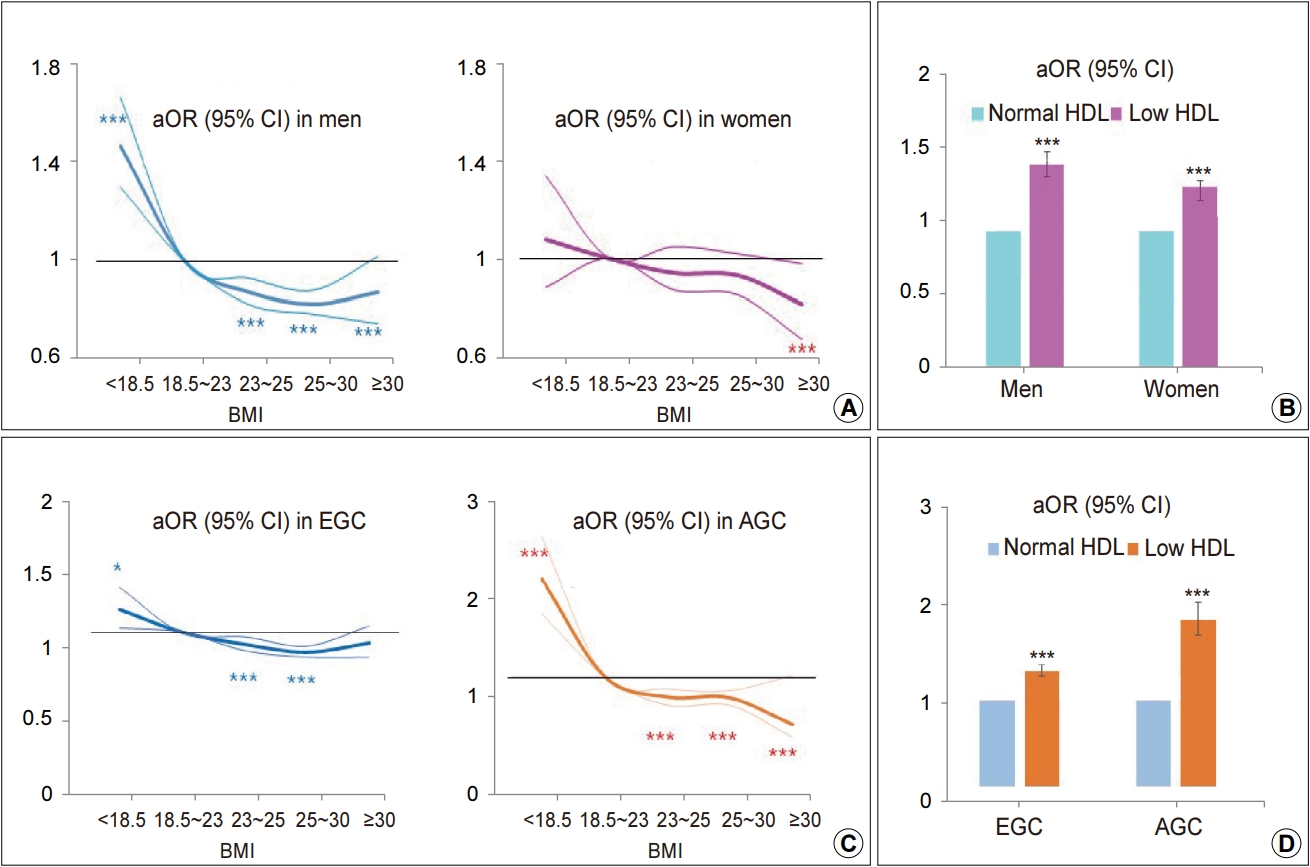
Effect of BMI and HDL-cholesterol (HDL-C) on gastric cancer. (A) Effect of BMI on gastric cancer when stratified by sex. (B) Effect of low HDL-C levels on gastric cancer when stratified by sex. (C) Effect of BMI on gastric cancer when stratified by tumor stage. (D) Effect of low HDL-C levels on gastric cancer when stratified by tumor stage. The thick solid line represents the aOR, and the thin solid line represents the 95% CI. aOR, adjusted odds ratio; EGC, early gastric cancer; AGC, advanced gastric cancer. *P<0.05 and ***P<0.001.
4. Sub-analysis by gastric cancer stage
In adjusted analysis, the relationship of many associated factors with EGC and AGC had a similar trend, but several factors are more strongly associated with AGC than EGC (Table 3). Low BMI strongly associated with AGC (OR, 2.09; 95% CI, 1.70~2.56) and higher BMI was inversely associated with AGC (OR, 0.46; 95% CI, 0.32~0.66), whereas the effect of low BMI on EGC was markedly attenuated (OR, 1.17; 95% CI, 1.03~1.34) (Fig. 2C). Low level of HDL-C was associated with both AGC (OR, 1.92; 95% CI, 1.74~2.13) and EGC (OR, 1.34; 95% CI, 1.27~1.41) (Fig. 2D).
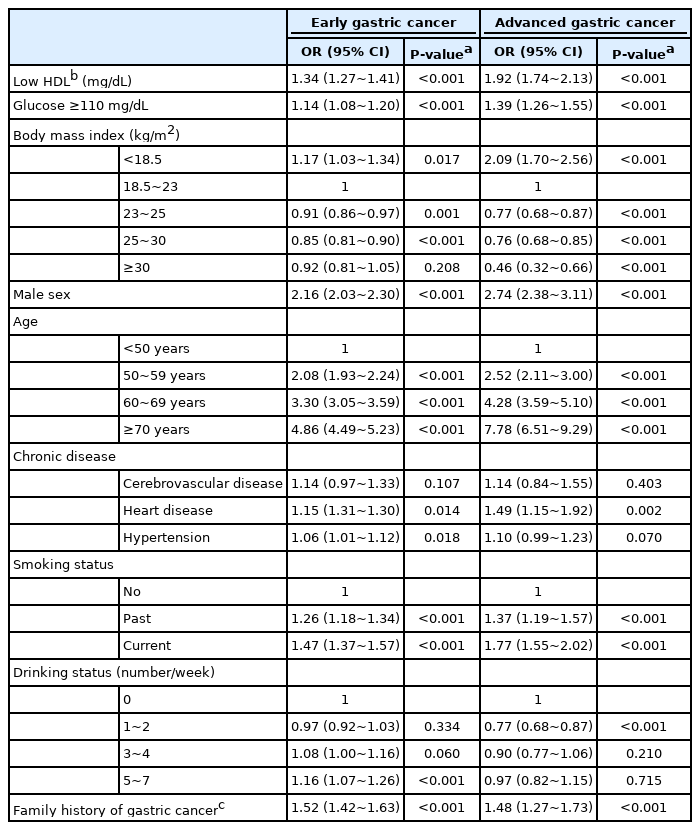
Contributing Factors to Gastric Cancer According to Tumor Stage (Multivariate Analysis)
DISCUSSION
To our knowledge, this is the first study to evaluate sex- and stage-specific association of HDL-C with gastric cancer. In adjusted analyses, low HDL-C, hyperglycemia, and low BMI were strongly associated with gastric cancer. In sex-specific analyses, low BMI was associated with gastric cancer in men but not in women. In stage-specific analysis, low BMI was strongly associated with AGC but BMI effect on EGC was markedly attenuated. However, low HDL-C was strongly associated with gastric cancer regardless of sex and stage.
In this study, low HDL-C was associated with gastric cancer with 1.4-fold in a national wide study. In sex-specific analysis, low HDL-C was constantly associated with gastric cancer in both men (OR, 1.49) and women (OR, 1.32). Previous studies suggest an inverse association of HDL-C with overall cancer risk in patients with diabetes [15] and in a meta-analysis [16]. A previous cross-sectional study suggested that high HDL-C (≥60 mg/dL) was associated with low incidence of gastric cancer (OR, 0.49) comparing to low HDL-C (<40 mg/dL) [17]. A small cohort study also showed that low HDL-C increased the risk of gastric cancer [18]. However, small number of gastric cancer (n=113 in a cross-sectional study and n=31 in a cohort study) didn’t allow sub-analysis by sex and stage in previous studies. The effect of low HDL-C on gastric cancer was also observed in both EGC (OR, 1.34) and AGC (OR, 1.92). This is the first study to investigated sex- and stage-specific effect of HDL-C on gastric cancer. Antioxidant properties of HDL-C may contribute to the beneficial effects of HDL-C on gastric cancer. Oxidants attack DNA, consequently transforming normal cells to neoplastic cells. Second, anti-inflammatory potential of HDL-C may be associated with anti-cancer effect. HDL-C mediates anti-inflammatory reprogramming of macrophage in mouse model and cell line [19].
Gastric cancer was associated with low BMI (OR of 1.37) and was inversely associated with the overweight and obesity (OR of 0.82~0.89) in this study. In sex-specific analysis, the effect of BMI in men was similar to that in overall gastric cancer, wherein low BMI had no association with gastric cancer in women. High BMI reduced the risk of NCGC in several studies [8,9], whereas it had no association with gastric cancer in some studies [10,11]. Our results are similar to that from recent population-based studies [20,21].
A population-based cohort study of 5.24 million UK adults shows that low BMI increases the risk of gastric cancer [20]. In a Chinese cohort study of 29,584 persons, subjects in the highest quartile of BMI have a lower risk of NCGC (HR, 0.65) compared with the lowest quartile [21]. The portion of cardiac gastric cancer was very low in our study (2.2%) and therefore the results look to be similar with Chinese study. The biologic mechanisms of the inverse association between BMI and NCGC are unclear. Persons with NCGC tend to use high levels of tobacco and alcohol and may be malnourished, and they have a high frequency of weight loss during the course of their disease [22]. Actually, BMI had a strong inverse association with AGC, but the association between BMI and EGC was markedly attenuated in the current study. The weak inverse association between BMI and EGC looks to be real effect of BMI on gastric cancer, wherein the strong inverse relationship of AGC with BMI looks to be results of the progression of gastric cancer.
In this study, hyperglycemia was modestly associated with gastric cancer in both men (OR, 1.26) and women (OR, 1.32). A prospective cohort study (Me-Can) shows that hyperglycemia increases the risk of gastric cancer with 1.58-fold in women but not in men [23]. Hyperglycemia was modestly associated with both EGC (OR, 1.14) and AGC (OR, 1.39). A plausible mechanism for the effect of hyperglycemia on gastric cancer is that patients with hyperglycemia are prone to insulin resistance and having higher levels of insulin and insulin-like growth factor 1 (IGF-1). Insulin induced proliferation of colon cancer cell line [24] and IGF-1 inhibits apoptosis, leading to cancer [25]. Another possible mechanism is that hyperglycemia may act as a direct carcinogen. High glucose induces DNA damage in cultured cells [26] and diabetes is associated with greater oxidative damage to DNA and increased generation of reactive oxygen species [27].
First-degree relatives were associated with gastric cancer with 1.5-fold in this study. Previous case-control studies suggest that family history increases gastric cancer with 1.5- to 3.5-fold [28]. Our results that gastric cancer was positively related to age with a dose-dependent pattern, are similar to many previous studies. Past and current smoker was also associated with 1.2- and 1.5-fold, respectively. This result is similar to that in a Japanese case-control study [29]. Frequent drinking was also positively associated with gastric cancer in this study. It’s similar to a previous meta-analysis that the pooled RR is 1.20 for heavy drinkers compared with nondrinkers [30].
This study has considerable strengths. First, we used a large data, and the large size allowed us to investigate the sex-specific effects of HDL-C and hyperglycemia on gastric cancer. Second, we evaluated stage-specific effect of HDL-C on gastric cancer for the first time. Last, the quality of demographic and laboratory data is high because we used subjects who underwent both gastric cancer screening and general health examinations. Nevertheless, this study has several limitations. First, we did not consider Helicobacter pylori (H. pylori) and dietary factors. However, previous small studies considering H. pylori and metabolic factors [17,18] showed that the effect of HDL-C and hyperglycemia on overall gastric cancer was similar to the results in the current study. Dietary factors, such as high salt and low fruit consumption, have a moderate association with gastric cancer. Second, this study did not consider potential factors affecting metabolism; use of lipid lowering agents, type of medication in patients with diabetes mellitus, and duration of metabolic disease. Third, further analysis using different definition of HDL-C, for examples three categories (low, moderate, high) may strengthen the inverse association between HDL-C and gastric cancer. Last, this is a cross-sectional study and therefore this study cannot provide the causality. A large population-based cohort study is needed to estimate the causal effect of HDL-C on the risk of gastric cancer.
In conclusion, low HDL-C and hyperglycemia were associated with gastric cancer in a large population-based study. In sex-specific analysis, low serum HDL-C and hyperglycemia were constantly associated with gastric cancer regardless of sex and stage. The constant positive relationship of low HDL-C with gastric cancer suggests that it needs to be considered as a risk factor. Further studies are needed to investigate the modulating effect of low HDL-C on gastric cancer development.
Supplementary Material
Supplementary Table 1.
Data Provided by National Health Insurance System
Supplementary Table 2.
Endoscopic Screening Reports in National Cancer Screening Program
Supplementary Table 3.
Contributing Factors of Gastric Cancer According to Sex (Univariate Analysis)
Acknowledgements
This work was supported by the National R&D Program for Cancer Control, Ministry of Health & Welfare, Republic of Korea (1631100) and the National Research Foundation, Republic of Korea (NRF-2015R1D1A1A01059219). The funders had no role in the design and conduct of the study; collection, management, analysis, and interpretation of the data; preparation, review, or approval of the manuscript.
Notes
No potential conflict of interest relevant to this article was reported.