


INTRODUCTION
In 2020, gastric cancer (GC) was responsible for more than one million new cancer diagnoses and approximately 769000 deaths. GC is the 5th most common cancer and 4th leading cause of death, worldwide [1]. Although the tumor-node-metastasis (TNM) system is widely used to stage cancer in patients, no pathological markers are effective for predicting recurrence and survival. Previous studies have reported that Slug expression is related to nodal stage [2] and that Slug and CD133 expression are related to peritoneal recurrence [3] in high-risk patients with GC.
Cancer recurrence and metastasis are driven by cancer stem cells (CSCs), which have unique self-renewal properties and malignant potential. The CSC hypothesis suggests that some cancer cells self-regenerate, multiply, and differentiate into various cell types [4]. This characteristic leads to cancer persistence and treatment ineffectiveness, even after surgery and chemotherapy. Adenosine triphosphate (ATP)-binding cassette subfamily G member 2 (ABCG2) and CD133 are the most frequently used markers in CSC identification.
ABCG2, an ATP-binding cassette transporter that transfers a broad range of substances, including drugs, metabolites, and other molecules, across the cell membrane [5], has been evaluated as a CSC marker. Accordingly, the elevated expression of ABCG2 is associated with resistance to anticancer drugs and poor prognoses in various carcinomas. In contrast, ABCG2 inhibits the metastatic cascade caused by toxic materials, thus allowing these materials to be discharged from the cell [6]. One previous study reported that ABCG2 expression was higher in poorly differentiated human gastric adenocarcinomas than in differentiated GCs [7].
CD133, a pentaspan transmembrane glycoprotein, is overexpressed in multiple solid tumor types, such as colon cancer and glioblastoma [8-10]. Also, it has been proposed as a marker for identifying CSCs in colon cancer [11]. Moreover, a study conducted in China that analyzed CD133 expression in 336 gastric adenocarcinoma cases indicated that CD133 might play a significant role in GC progression [12].
Several studies have shown that the biological functions of ABCG2 are closely related to the formation processes of many tumor types; however, its role in the occurrence and development of tumors remains unclear. In lung cancer, CD133 and ABCG2 expression are related to tumor invasion and metastasis. Some studies have reported that ABCG2 is upregulated in CD133-positive tumor cells [13,14]; its expression correlates with the presence of CD133-positive cells in colorectal cancers (CRCs) [15]. However, the relationship between these stemness-related markers and their clinical impact in patients with GC has not yet been elucidated. Therefore, this study aimed to determine the effect of ABCG2 and CD133 expression on the clinical outcomes of patients with GC.
METHODS
Patient selection and study design
In this study, cases of patients with GC who underwent resection were selected and retrospectively reviewed. A total of 459 cases were randomly selected for inclusion in this cohort from among 2495 patients who underwent gastrectomy at Seoul St. MaryŌĆÖs Hospital (Korea) between January 2000 and December 2009. The cases were limited to patients with stage I to stage III cancer; gastrectomies were not initially performed in patients with stage IV disease. After excluding missing cases, 411 cases were selected for analysis.
The collected data included patient demographics, clinical findings, pathological diagnosis, and additional treatments, such as chemotherapy and specific regimens. Survival time was calculated from the day of surgery to the last known date when the patient was confirmed to be alive or recurrence-free. Data from medical records and from the National Cancer Center of Korea database were used if data from Seoul St. MaryŌĆÖs Hospital were unavailable. Cancer stages were defined using the eighth edition of the American Joint Committee on Cancer (AJCC) criteria [16]. The tumor histologic grades were determined according to the AJCC Cancer Prognostic Factors Consensus Conference (grade 1, well-differentiated; grade 2, moderately differentiated; grade 3, poorly differentiated; and grade 4, undifferentiated) [16].
The specimens were collected with the approval of the Institutional Review Board of the Seoul St. MaryŌĆÖs hospital, Catholic University of Korea (KC20RISI0503). The need for informed consent was waived due to the retrospective nature of the study.
Tissue microarray and immunohistochemistry
Tissue microarrays (TMAs) were produced from formalinfixed, paraffin-embedded tumor tissues acquired from primary GC specimens, using a manual tissue arrayer (Quick-Ray Manual Tissue Microarrayer; Unitma Seoul, Korea).
TMA slides were prepared and stained after the surgical resection of GC lesions to assess protein expression (Manual tissue arrayer MTA-1; Beecher Instruments, Sun Prairie, WI, USA). Immunohistochemical staining was performed for ABCG2 and CD133.
Tissue sections (4-╬╝m thick) were cut from paraffin-embedded blocks, followed by antigen retrieval and blocking of endogenous peroxidases after sample deparaffinization and rehydration. The sections were then incubated with rabbit polyclonal anti-ABCG2 monoclonal antibodies (dilution, 1:100, cat. no. sc-18841; Santa Cruz Biotechnology, Dallas, TX, USA). For the negative controls, the primary antibodies were substituted with normal rabbit IgG at the same concentration. Additional sections were immunostained using anti-CD133 antibodies (dilution, 1:650, GTX60471; GeneTex, San Antonio, TX, USA) at a 1:650 dilution. The sections were incubated at room temperature for 90 minutes with the anti-CD133 antibodies and overnight at 4┬░C. Positive controls were used as suggested by the supplier. The primary antibody was omitted from the negative control specimens. Normal positive control staining was performed using gastric epithelial tissue.
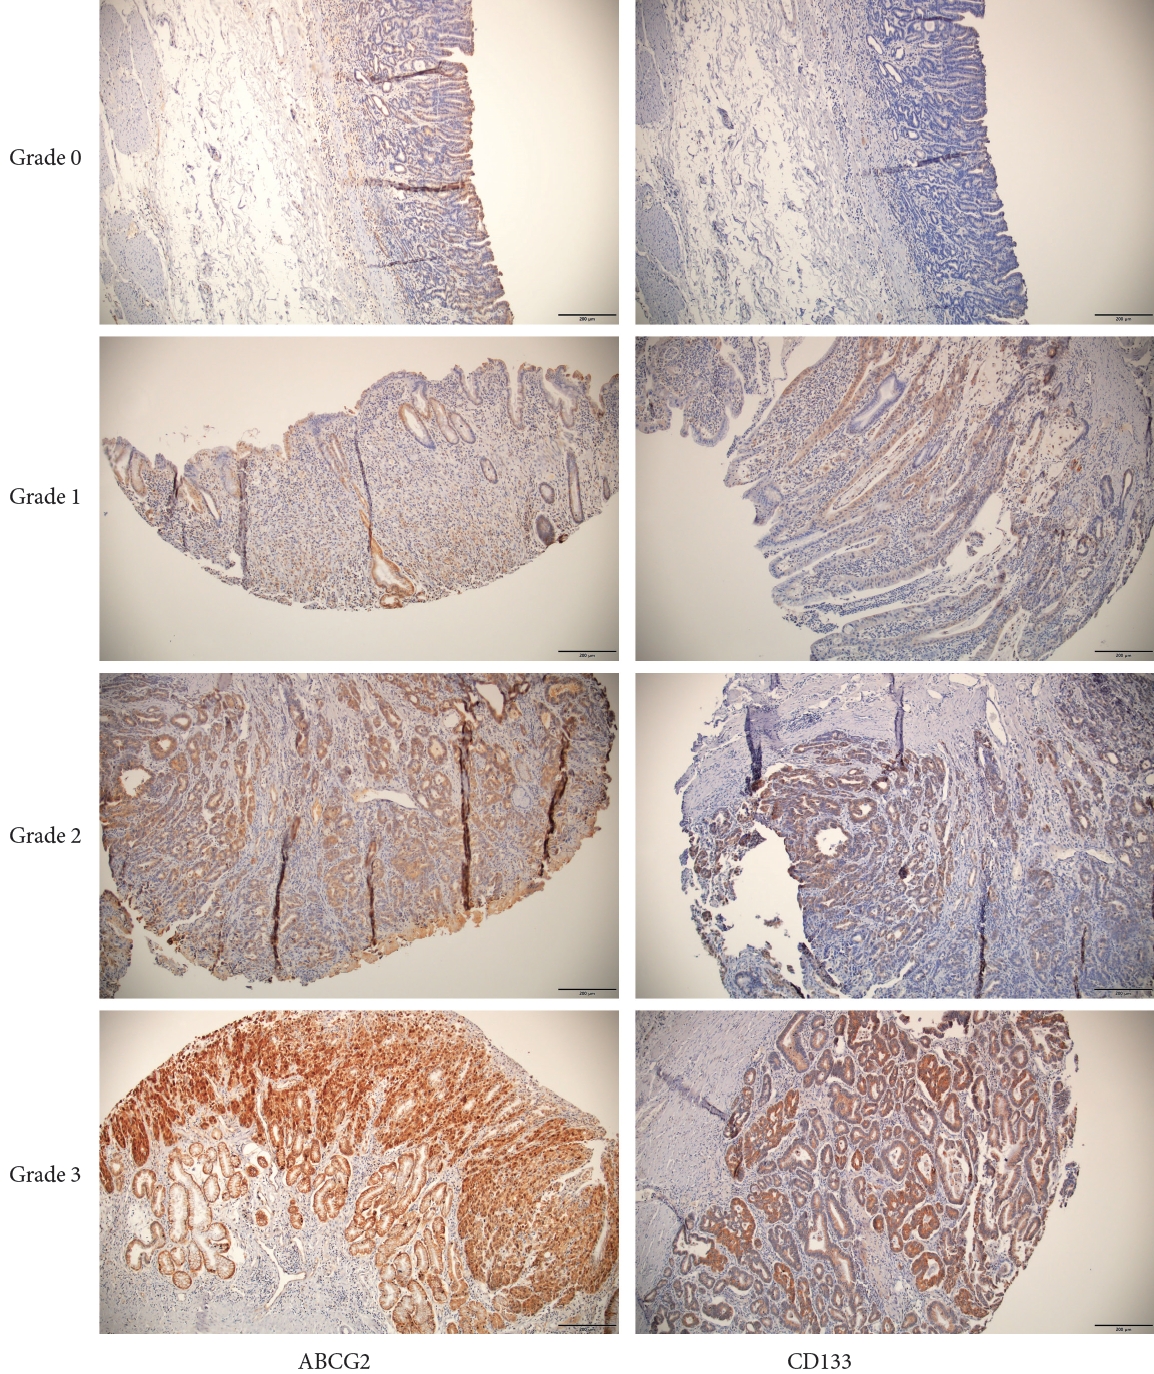
A semiquantitative scoring system, based on staining intensity, was used to score CD133 and ABCG2 expression. The staining intensity was graded from 0 to 3 (0, no expression; 1, weak; 2=moderate; 3=strong). The ABCG2 and CD133 immunohistochemical staining results, stratified by grade, are shown in Fig. 1. The expression levels of ABCG2 and CD133 were dichotomized as either high or low based on the median expression patterns (staining intensity >2).
Outcome measures
Immunohistochemical staining scores were used to determine the levels of ABCG2 and CD133 expression, which were then assessed for association with disease severity and patient survival. Overall survival (OS) and recurrence-free survival (RFS) rates were estimated. OS and RFS were calculated as the number of years from randomization to the date of death or last contact.
Statistical analyses
Continuous data are presented means┬▒standard deviations; categorical data are expressed as quantities and proportions. To evaluate the differences between groups, according to their ABCG2 and CD133 immunoreactivity, Žć2 and two-sample in-dependent t-tests were used for categorical data and continuous variables, respectively. Cumulative patient survival curves, according to ABCG2 and CD133 immunoreactivity, were generated using the KaplanŌĆōMeier method; between-group differences were compared using the log-rank test. Multivariate analyses were performed using the Cox proportional hazards regression model to identify factors associated with OS and RFS. Survival distribution was estimated using the KaplanŌĆō Meier method. Univariate and multivariate Cox proportional hazards models were used to explore the associations between the biomarkers or clinical variables and OS. Multivariate models were adjusted for covariates. The score and likelihood ratio test p-values were used to test the significance of each covariate in the univariate and multivariate models, respectively.
RESULTS
Characteristics of the patient population and stage
The characteristics of the 411 patients expressing ABCG2 and CD133 included in the analysis are summarized in Table 1. The average age of the patients was 58.2┬▒11.9 years, with males accounting for 67.9% of the included patients. The cancer stage of each patient was classified based on the TNM staging system using the AJCC criteria; 31.4%, 28.5%, and 40.1% of the patients had stage I, II, and III disease, respectively. Poorly differentiated tumors were observed in 61.6% of the patients, and the percentage of undifferentiated tumors was higher in tumors at higher stages (48.8%, 58.1%, and 73.9% for stages I, II, and III, respectively; p<0.001).
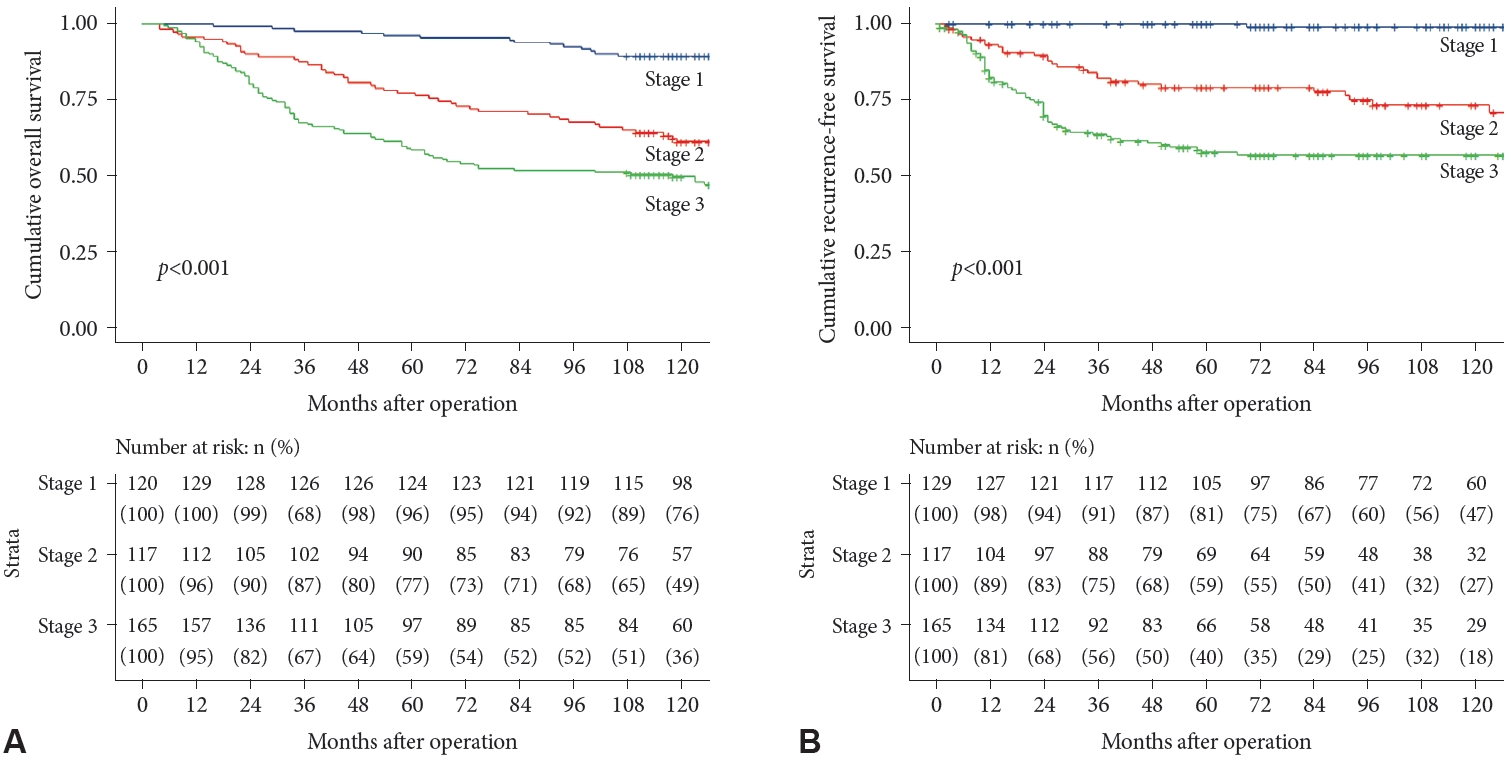
Total gastrectomies were performed on 36.0% of the patients, and the proportion of total gastrectomies increased as the disease stage increased (21.7%, 39.3%, and 44.8% for stages I, II, and III, respectively; p<0.001). Adjuvant chemotherapy was administered to 64.0% of the patients. Recurrence was observed in 23.1% of the patients; 38.9% of the patients died. Both OS and RFS trended downward as the cancer stage increased (Fig. 2).
ABCG2 and CD133 expression and clinicopathologic factors
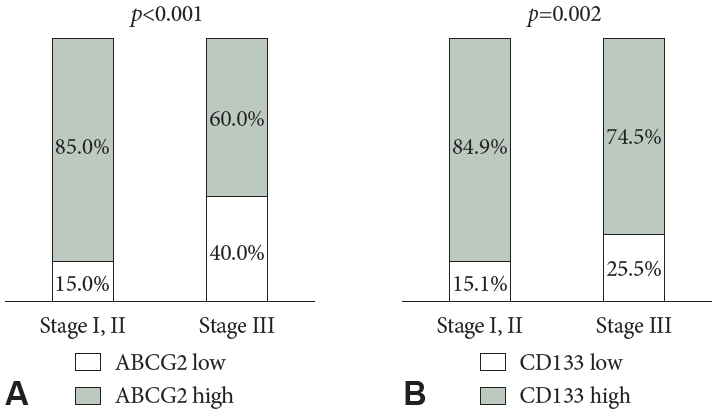
ABCG2 expression was significantly and positively correlated with CD133 expression (R=0.559; p<0.001). High levels of ABCG2 expression were observed in 74.9% of patients; high CD133 expression was found in 80.5%. The clinicopathological characteristics, based on ABCG2 and CD133 expression, are summarized in Table 2. Both ABCG2 and CD133 expression levels were higher in patients with stage III disease than in those with stage I or II disease (p<0.001 and p=0.002, respectively) (Fig. 3). Lower ABCG2 expression was associated with higher nodal stages. Furthermore, low expression levels of both ABCG2 and CD133 were associated with poor differentiation.
Patient survival and ABCG2 and CD133 expression
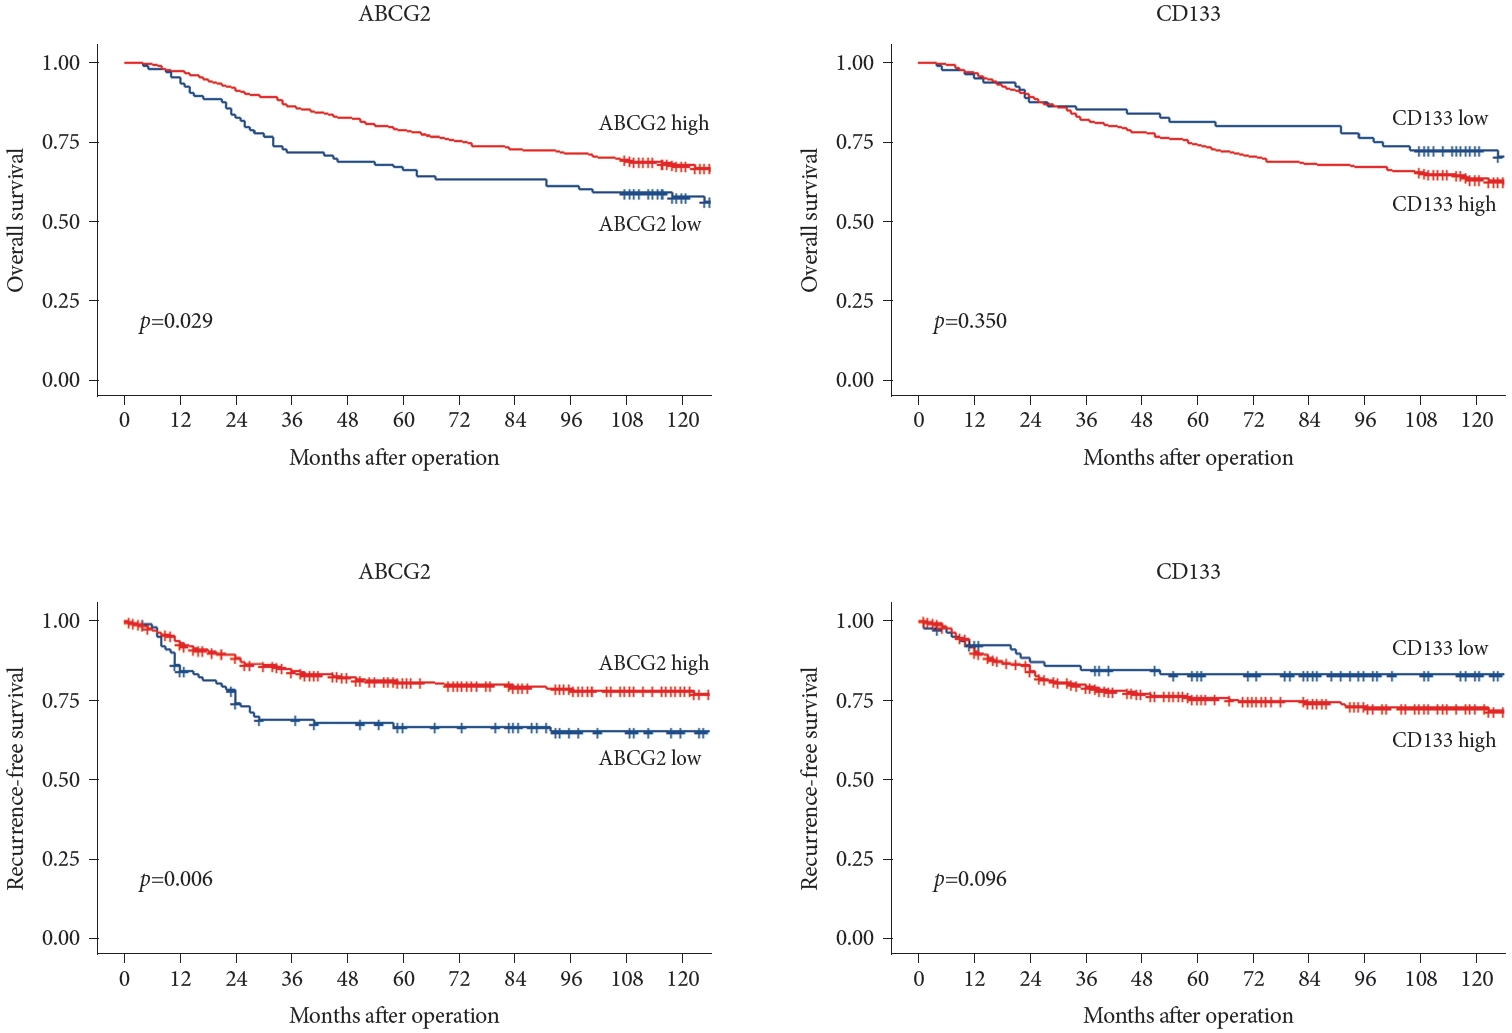
Fig. 4 summarizes the OS and RFS rates associated with ABCG2 and CD133 expression levels. Patients with high CD133 expression showed worse OS and RFS outcomes than did the group with lower CD133 expression, although the difference was not statistically significant. In contrast, the group with high ABCG2 expression showed significantly improved outcomes than did the low ABCG2 expression group in terms of both OS (p=0.029) and RFS (p=0.006).
Tumor cells expressing ABCG2 and CD133 were divided into four groups based on their expression levels: ABCG2low CD133low, ABCG2low CD133high, ABCG2high CD133low, and ABCG2high CD133high. When assessing the OS and RFS for each group, significant differences were observed (p=0.014 and p< 0.001, respectively) (Fig. 5A). In the survival analysis (Fig. 4), high ABCG2 expression was associated with favorable outcomes, whereas high CD133 expression was associated with poor outcomes. When ABCG2 expression was high and CD133 expression was low, there was no statistically significant difference in outcomes between the groups. However, the ABCG2highCD133low group had the best outcomes, whereas patients with ABCG2lowCD133high cells had the worst OS and RFS outcomes (p=0.012 and p=0.003, respectively) (Fig. 5B).
Cox proportional hazards regression analysis was performed to examine multiple parameters. In the univariate analysis, stage, age, chemotherapy, and ABCG2 expression were associated with OS. After adjusting for these factors, stage, ABCG2 expression, and CD133 expression remained significantly associated with OS. Stage, chemotherapy, and ABCG2 expression were significant predictors of RFS. However, after multivariate analysis, only tumor stage, ABCG2 expression, and CD133 expression were significant predictors of RFS (Table 3); adjusted survival curves corresponding to stage and ABCG2 and CD133 expression levels are shown in Fig. 6.
Subgroup analysis of patients who received systemic chemotherapy
To investigate the effect of ABCG2 expression on survival, a subgroup analysis was performed in patients who underwent systemic chemotherapy. The patients were divided into two groups based on whether they received systemic chemotherapy. Compared with those expressing low levels of ABCG2, the high ABCG2 expression patients exhibited better outcomes among individuals who received systemic chemotherapy, specifically demonstrating a significant improvement in RFS (p=0.039). Conversely, there was no statistically significant difference in the outcomes of patients who did not receive chemotherapy based on their ABCG2 expression levels. The results are shown in Fig. 7.
DISCUSSION
This study investigated the relationships between the expression of two stemness-related markers, ABCG2 and CD133, and the outcomes of patients with GC. High expression levels of ABCG2 and CD133 were observed in 74.9% and 80.5% of the patient tumors, respectively. High ABCG2 protein expression was significantly associated with increased differentiation, lower nodal stage, and better OS and RFS rates; high CD133 expression was associated with a higher nodal stage and worse OS and RFS rates. After adjusting for disease severity, high ABCG2 expression remained a significant factor associated with patient outcomes.
In general, the expression of CSC markers has been thought to be associated with worse outcomes in previous studies, owing to their potential roles in tumor growth, metastasis, and treatment resistance. However, in the present study, ABCG2 and CD133, which are both CSC markers, exhibited divergent associations with the outcomes of patients with GC.
Numerous studies have proposed that the presence of CD133-positive cells facilitates recurrence and metastases. Consequently, elevated expression of CD133 serves as an indicator of shorter survival times, including for GC [17,18]. In one meta-analysis, upregulation of CD133 was found to be linked with advanced TNM stage and the occurrence of distant metastasis. That analysis highlighted a substantial correlation between CD44 and CD133 expression and the OS of patients with GC [16]. Our results indicate that elevated CD133 expression levels correlate with decreased survival rates, consistent with the findings of previous studies.
The relationship between ABCG2 expression and the outcomes of various cancers, including GC, is not fully understood. Previous studies have focused on the role of ABCG2 in multidrug resistance and treatment failure because the protein is known to pump chemotherapeutic substances, such as doxorubicin, methotrexate, mitoxantrone, and topotecan, out of the target cells. However, limited data and small sample sizes have hindered a comprehensive understanding of the effects of ABCG2 expression levels on outcomes [19].
ABCG2 is a crucial regulator of multidrug resistance in various solid tumor types, including GC, owing to its role in actively pumping endogenous metabolites, xenobiotics, and toxins out of cells [20,21]. In a biostatistical analysis of data from the National Center for Biotechnology Information (NCBI) database, ABCG2 expression was positively correlated with CRKL levels in GC, an independent feature associated with poor outcomes. Additionally, the inhibition of ABCG2 expression suppresses the proliferation of poorly differentiated GC cell lines (MKN-45), leading to cell cycle arrest and the induction of cell apoptosis [22]. Another study analyzing surgically resected GC tissues found higher ABCG2 expression in poorly or undifferentiated carcinomas than in well-or moderately differentiated gastric carcinomas [23]. Furthermore, in a study of human gastric adenocarcinoma cases, elevated ABCG2 and CD133 expression levels were more frequent in poorly differentiated adeno-carcinomas and diffuse-type GCs [7].
Considering the association of ABCG2 with cancer cell stemness and drug resistance, elevated ABCG2 expression levels were initially hypothesized to negatively affect patient prognosis. Surprisingly, our results showed that high ABCG2 expression was associated with significantly better survival of patients with GC. This led to the hypothesis that low ABCG2 expression levels may be associated with poor outcomes as a result of the reduced capacity of cells expressing the protein to prevent toxin accumulation in cells, contributing to cancer development by enabling the accumulation of carcinogens. Supporting this hypothesis, a study of intrahepatic cholangiocarcinomas revealed that tumors with low ABCG2 expression levels exhibited aggressive behavior, poor prognoses, lymph node involvement, and advanced histological grade [24]. Similarly, high levels of membranous ABCG2 expression are associated with better clinical outcomes in patients with CRC [6].
A subgroup analysis of patients who received systemic chemotherapy provided additional evidence supporting the role of ABCG2. Among patients who underwent chemotherapy, those with high ABCG2 expression levels exhibited more favorable outcomes than those in the group with low expression levels. This highlights the potential role of ABCG2 as a membrane transporter in the maintenance of cell homeostasis. Higher ABCG2 expression may contribute to the export of toxic substances from cells, thereby enhancing cell survival and improving prognoses. ABCG2 plays a crucial role in the export of toxic intracellular substances. Reactive oxygen species (ROS) are primary regulators of tumor cell survival and metastatic cascades. Based on this information, high ABCG2 expression can be postulated to result in reduced ROS production, leading to improved OS and RFS rates.
In our study, undifferentiated tumor tissues exhibited significantly lower ABCG2 expression than more differentiated tumors. We hypothesized that the poor outcomes associated with the low ABCG2 expression group were because the ABCG2 protein is physiologically expressed in epithelial cells of the gastrointestinal tract to perform absorptive functions, including transporting toxic materials from cells [25]. In the present study, undifferentiated tumors exhibited significantly lower ABCG2 expression levels than did the more differentiated tumors. Therefore, we hypothesized that decreased levels of transporter proteins (such as ABCG2) are associated with carcinomatous transformation due to reduced cellular transportation.
The present report has an advantage over previously published research. Our data were generated using a large number of patients and immunohistochemical analyses. Other studies have reported findings based on immunohistochemistry samples and clinical data results from fewer than 100 individuals. In contrast, we analyzed samples and associated clinical histories from more than 400 patients.
Our study has certain limitations. Intratumoral heterogeneity was possible due to our use of a tissue cylinder with a 2-mm diameter, which is larger than the 0.6-mm cylinder diameter frequently used to obtain sections from viable tumor cell regions for TMA investigations. Even if the results from each area were comparable, the question of tumor heterogeneity remained. Second, our study included only an Asian population. Further studies involving other ethnic groups are warranted.
In conclusion, our data demonstrated that tumor expression levels of ABCG2 and CD133 are associated with clinical outcomes in patients with GC after surgery. Specifically, high ABCG2 and low CD133 expression levels correlated with better survival outcomes. These findings suggest the potential utility of ABCG2 and CD133 expression levels as biomarkers for predicting outcomes for patients with GC.